Web Debugging Proxies used for Ad Detection
Web debugging proxies are used to test the ads on the page their behavior and their response to the ad call. This can’t be tracked with the naked eye hence we go for a tool that tracks a session of the web code during that call to the respective web servers. Here are two ways of doing, among which I prefer doing the 2nd way as it got data with it to show and confirm the reason on the functionality of the ads.
- Firebug.
- Fiddler
Firebug:
This is an extension to the browsers(Chrome, Firefox). This helps in getting the piece of code that is being hidden by the web developer during coding. The usage of Firebug is as follows:
- First open the page you want to check the ad calls on that page.
- Click over the firebug extension on your browser.
- Then a window at the bottom of your screen would popup.
- Scroll down till you get the ad slot for which you want to check for.
- Then click on the inspect option on the popup bar and the cursor will now turn to selector.
- Then place your cursor on the ad that you doubt of rendering.
- It would display the code that is embedded with in that ad.
- This helps you to deduce a conclusion where you can see the tags that are placed in the server with code being encrypted i.e converted to ASCII values.
- This will help you find the description of the ad.
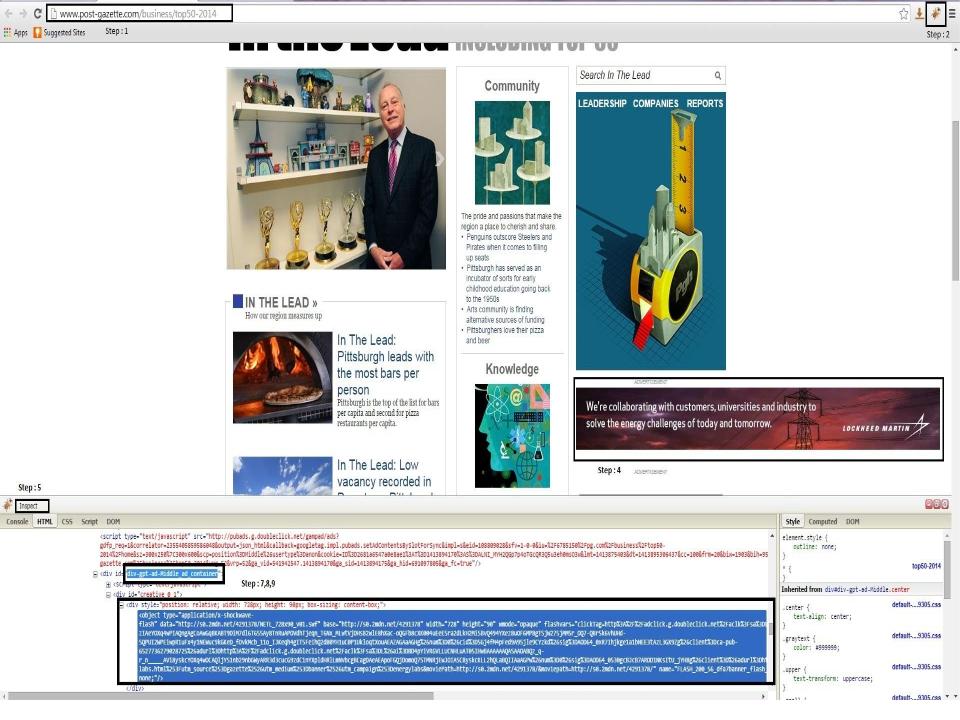
- Please refer to the screenshot mentioned below with above steps mentioned in it.
A recent case for your better understanding:
There was client who was facing problem with an ad being served twice on the page leaving the page look to get disturbed. Upon checking the setting in the DFP server it seems to be perfect. However the issue still seems to be persists.
Then the team has checked for the ad slot on the page with firebug. This has helped the team to get to the root cause of the issue. The reason was the code put in the div tag of the ad was of a 728×90 which has lead a leaderboard to serve in 300×250 slot. Screenshot mentioned for your reference.(In screenshot div tag with name middle is for 300×250).
Fiddler:
This is also a web debugger that breaks the webpage into sessions and calls from the page to the servers. Here we need to search for the ad calls. The check points for this is as follows:
- Open the page where you want to troubleshoot the ads. Open the fiddler at the same time the page opens and wait till the complete page loads.
- Check for the link in the fiddler session as ad.doubleclick.net or pubads.doubleclick.net.
- Then click on the option that is to the right side of the fiddler panel called the inspector.
- Then click on the option web form in the upper half of the tab of the fiddler UI.
- By scrolling in the above window we can see the URL in which ad is rendering and call request.
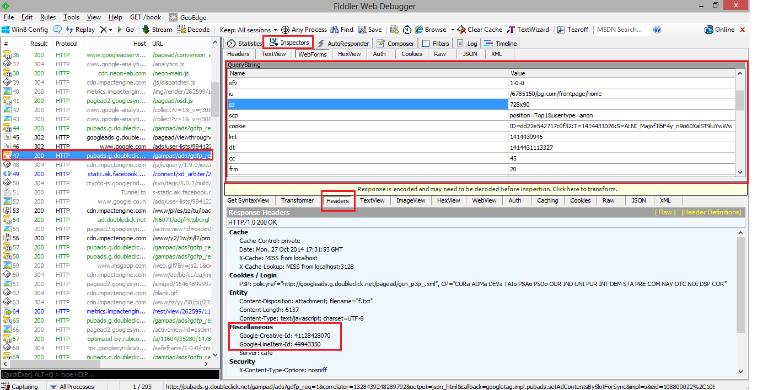
- Then click on headers in the below window of the Fiddler UI.
- Here you will find the line item from which the ad call is being made.
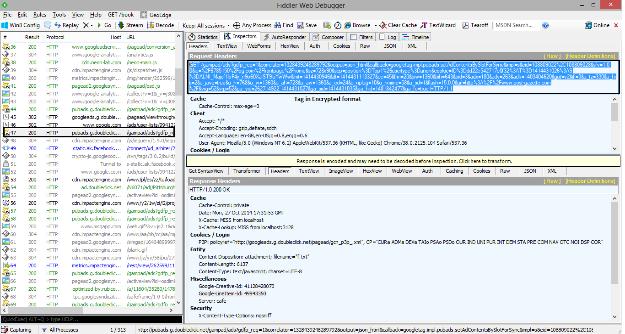
- Click on Raw tab in the upper window of the fiddler UI to get the complete ad tag from the ad request tad.
With these steps you can come to a confirmation that the creative is rendering from where. In the web form tab we can get the ord value. upon checking of every call we can conclude DFP is expanding the cache-buster macro. When we click on the creative we can see a call in fiddler: googleleads.g.doubleclick.net
The above tag found mean that the click action is performed.
Please check for the screenshots below for pictorial representation of the usage of the proxies.
Thanks for the Info …
Please provide download link for firebug.
Thanks
Please check your email.